Measuring Student Loan Default Today

​The cohort default rate (CDR) measures the share of student loan borrowers who default on their debts and is an important accountability measure for colleges and universities. It shows how many students are facing the worst possible outcome shortly after leaving college: being unable to repay their loans. Institutions with high CDRs can lose access to federal financial aid dollars.

The CDR has always been a limited measure of student outcomes as it doesn’t capture nuances in borrowers’ repayment choices. But the student loan repayment pause, put into effect during the pandemic to prevent default, has made the CDR nearly meaningless because no borrowers have defaulted since March 2020. President Biden has announced that the repayment pause will end on December 31, 2022, but it will be years before the CDR data return to normal. Federal policymakers and institutions will need new ways to measure how well borrowers are prepared for success in the labor market.​

Default is on the decline for all sectors

​Student loan default happens if a borrower doesn’t make any payments on their loan for 270 days. At that point, the borrower’s entire loan balance becomes due immediately and they can have their paychecks garnished and tax refunds withheld.

Institutions are also penalized if too many of their students default on their loans. This outcome is measured by the CDR, which compiles a three-year average indicating how many borrowers default after beginning repayment. Institutions with high CDRs (above 30 percent) can lose their access to Title IV funds.

Prior to the student loan repayment pause, CDRs varied from year to year and across sectors. Figure 1 shows default declined for all sectors for the cohort that began repayment in 2017–18. This major change is due to the student loan repayment pause.


The loan repayment pause and default

​Since March 13, 2020, most federal student loan payments have been paused and interest has been set to 0 percent. The U.S. Department of Education placed these loans in administrative forbearance, meaning that borrowers who are not making payments are not counted as in default. The number of borrowers in forbearance has increased from 4.6 million to 25.4 million—450 percent—since the beginning of the repayment pause. Currently 60 percent of all borrowers are in forbearance.

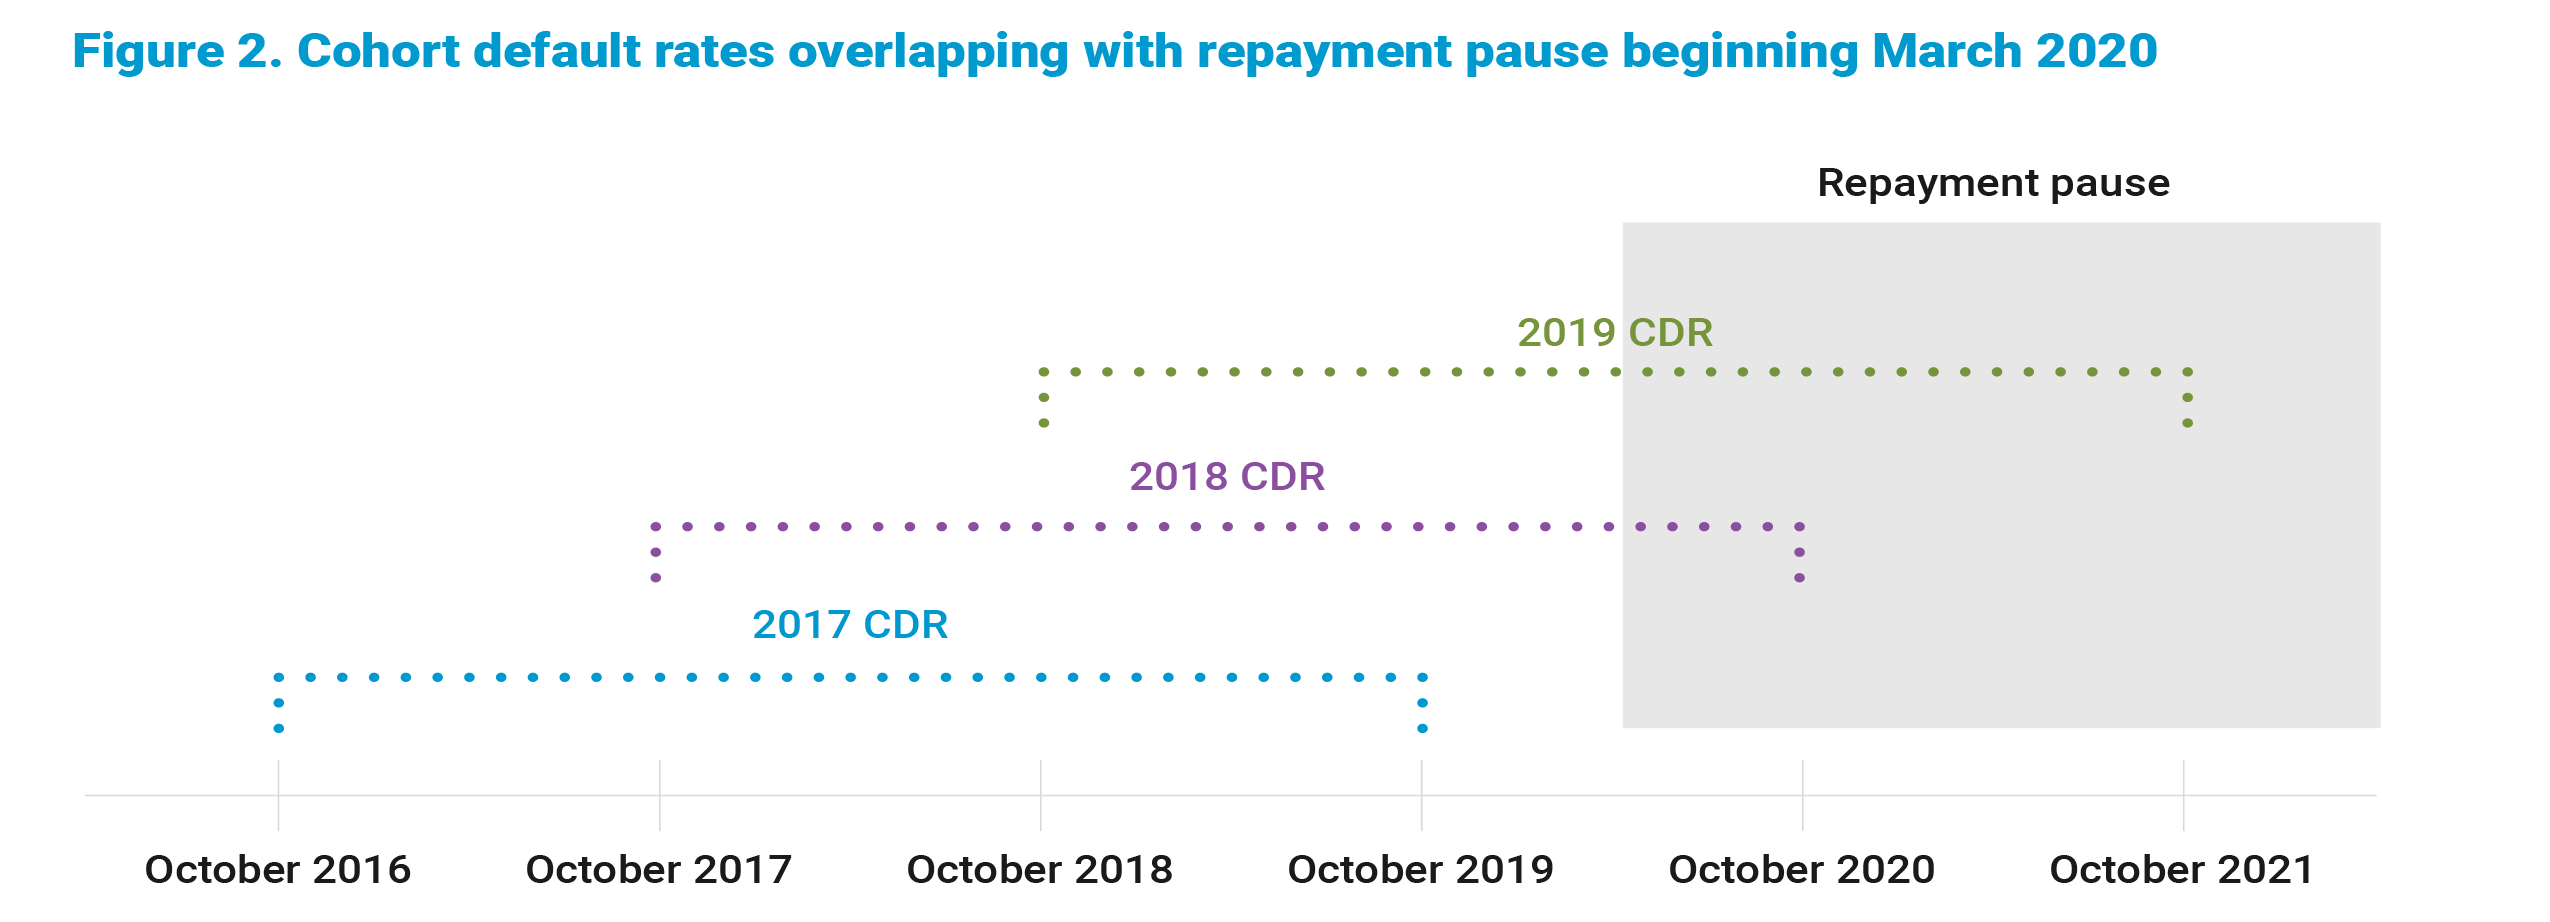
Because the CDR is measured across three years, it will take some time before the CDR reflects the repayment pause. The 2018 CDR included borrowers who entered repayment in 2018 and defaulted in 2018, 2019, or 2020. That’s why the 2018 CDR dipped: many borrowers were unable to default during the last part of this time period since no payments were required.

The 2019 CDR, which will be released this fall, will include borrowers who entered repayment in 2019 and defaulted in 2019, 2020, or 2021. The pandemic repayment pause covers half of the time period included in the 2019 CDR, as shown in Figure 2. In all likelihood, we will see another sharp drop in the CDR.


Policy connections

​Policymakers use the CDR to determine whether institutions should have access to Title IV funds. Without reliable data, the CDR will be unable to signal which borrowers are struggling and which institutions should be held accountable for their poor outcomes. Though the loan repayment pause is coming to an end in December, it will still be years before the CDR has accurate data because it is calculated over a three-year period.

With that in mind, institutions and policymakers should consider alternative measures of borrowers’ abilities to manage their loans. The gainful employment regulations proposal includes a debt-to-earnings ratio, which looks at how much a student earns after leaving college relative to how much they borrowed to attend college; this is one way to indicate whether the burden of borrowers’ cumulative debt is reasonable. This measure does not rely on repayment data and may be more intuitive for prospective students and the public to understand than the CDR.

About Facts in Hand

​​Facts in Hand is a data-driven series exploring the state of higher education today.​ Other posts in the series:

College Enrollment During the Pandemic

Students of Color and Degree Attainment

Who Is Borrowing for College?

Keeping the United States Competitive (PDF)